
2025 CRE Recap: Industrial Dominance And Key Investment Takeaways

Across commercial real estate, 2025 nears its end. Interest rates remain uncertain. The industrial sector shows clear momentum. This analysis explains what took place in capital markets this year.
I’ll break down sector-by-sector performance, note where the industrial sector dominated and share sound investment strategies that suit current conditions. Data from sources like JP Morgan Chase, CBRE, and the federal reserve back this review.
Key Takeaways
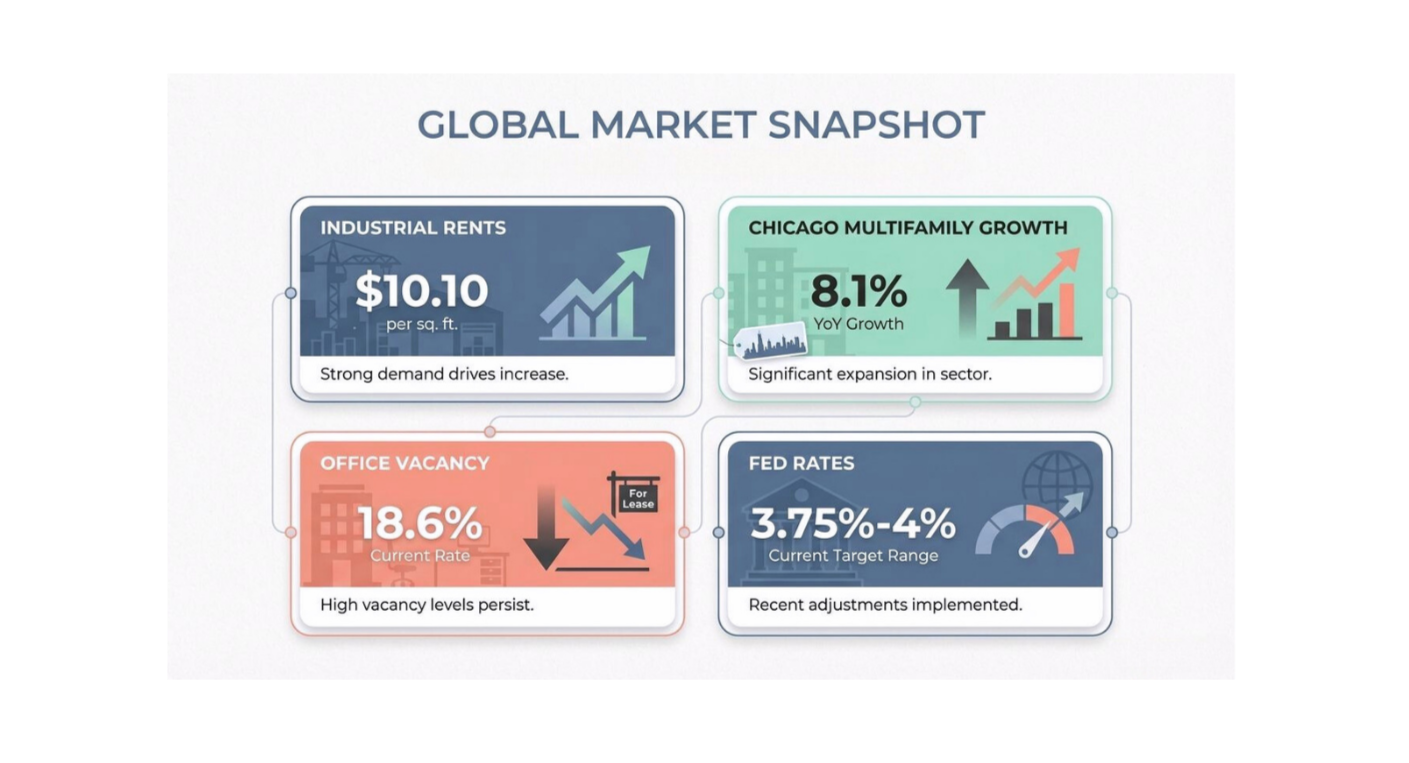
The industrial sector led 2025 CRE performance with national asking rents reaching $10.10 per square foot in Q3, up 1.7% year-over-year. Small-bay space under 100,000 square feet maintained vacancy below 5% despite broader market softness.
Multifamily investment showed surprising resilience as Chicago led with 8.1% effective rent growth and metros in Northern New Jersey and New York pushed occupancy above 97%, signaling near-full recovery from past supply pressures.
Office properties faced steep challenges with national vacancy at 18.6% as of October 2025. Sun Belt markets like Austin hit 27%, driving landlords to reposition and explore flexible workspace strategies.
The Federal Reserve cut rates to 3.75%-4% in October 2025.
2025 CRE Market Performance Overview
Transaction activity began to quicken as the Federal Open Market Committee’s rate decisions eased a familiar anxiety in the credit markets: that financing would tighten further just as owners were forced back to lenders. By December, prices were up 4.2% from a year earlier, a modest but meaningful sign that the market was stabilizing and that buyers were willing to reengage.
For much of the year, the Federal Reserve kept rates steady, and that consistency mattered. It helped preserve valuations across property types and gave lenders and investors a clearer baseline for underwriting.
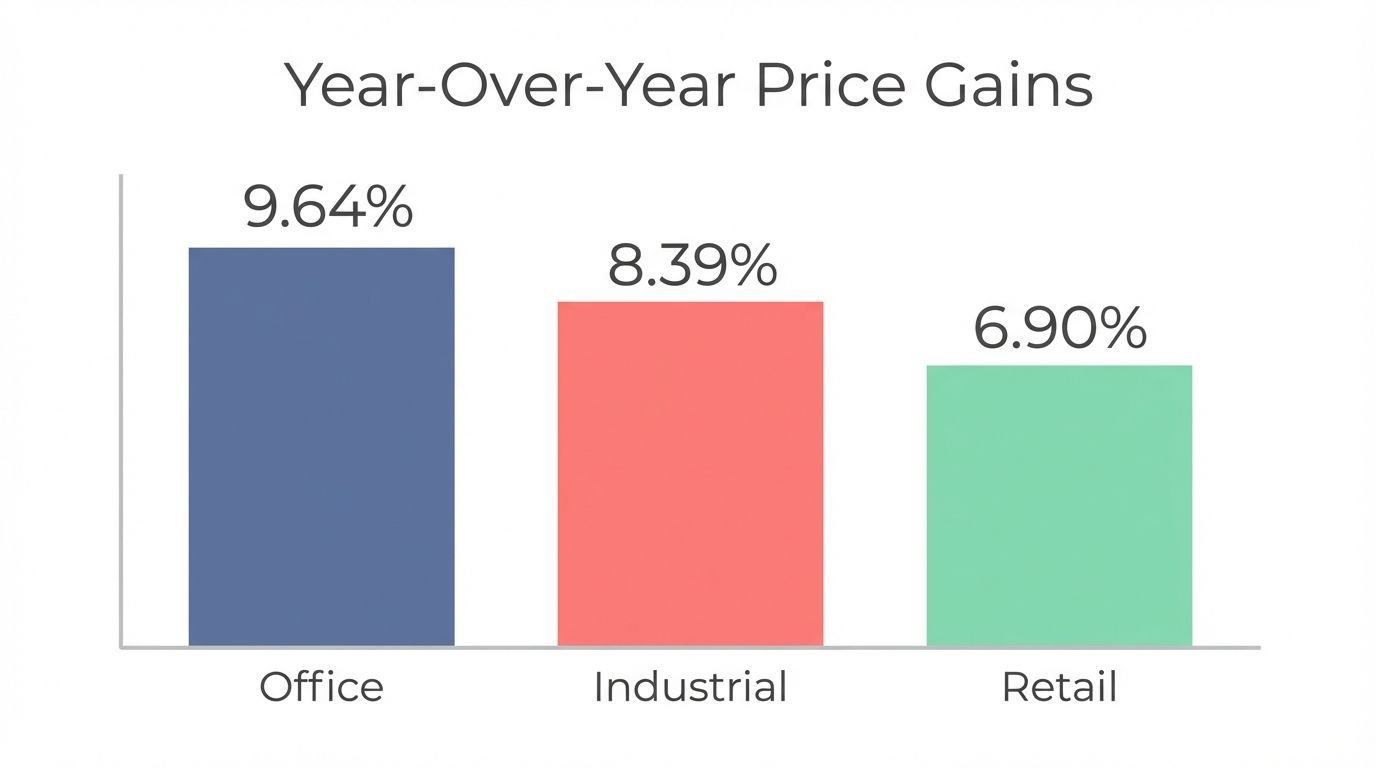
The rebound showed up unevenly. Office prices rose 9.64% year over year by August, while retail climbed 6.90%. Industrial pricing softened slightly month to month in August, yet still stood 8.39% higher than the previous year, according to JPMorgan Chase and Freddie Mac.
Even as confidence returned, selectivity sharpened. Buyers remained focused on durable cash flow, clear leasing stories, and defensible exit assumptions. Still, capital formation and liquidity supported a broader recovery in dealmaking: second-quarter sales volumes rose 43% year over year, with office transactions up 66%, retail up 45%, and industrial up 27%. The top of the market also stirred. In September, transactions above $100 million increased 17% month over month, and deals between $50 million and $100 million climbed 26%, suggesting that larger investors were again willing to write checks, not just watch from the sidelines.
How did market stabilization and transaction trends evolve in 2025?
As 2025 wore on, the market’s tone shifted. After a volatile stretch, commercial property prices returned to a steadier, more predictable climb, and the sense of free fall that had shadowed parts of the sector began to fade. By the second half of the year, the story was less about stress and triage and more about whether a recovery was taking hold and what it would look like across asset types.
Much of that stabilization traced back to the Federal Reserve’s posture. By keeping policy relatively steady, and signaling changes with more restraint than surprise, the Fed gave investors and lenders something the market had been missing: a clearer framework for pricing risk. Borrowing conditions did not suddenly turn easy, but they became more workable. As financing markets recalibrated, participants regained enough confidence to underwrite deals with less defensiveness and more discipline, setting the stage for transaction activity to resume.
What impact did interest rate changes have on commercial real estate?
The Federal Reserve’s 25-basis-point cut in October 2025 lowered the federal funds rate to a 3.75% to 4% range, but it did not translate into an immediate thaw in financing. Even as Chair Jerome Powell acknowledged disagreement inside the committee about whether another cut might follow in December, lenders largely kept their guard up.
The market was still absorbing the weight of earlier hikes. With the 10-year Treasury yield hovering around 4.47%, cap rates and valuations remained under pressure, and credit stayed constrained. Underwriting tightened further, with higher debt service coverage ratios becoming a harder gate for many deals, particularly those that relied on aggressive rent growth assumptions.
Multifamily felt the squeeze most acutely. Refinancing became more difficult and more expensive, and access to traditional liquidity sources, including Fannie Mae and major lenders, narrowed for some borrowers. Retail and industrial held up better, supported by steadier income fundamentals, but higher borrowing costs still compressed the margin between cap rates and debt yields, complicating pricing on new acquisitions.
Office, already wrestling with weakened demand in many markets, faced an even sharper reality check. As liquidity thinned, sellers were forced to reset expectations, and pricing benchmarks in major urban cores moved down accordingly.
How did capital formation and investor sentiment shape the market?
Capital surged into commercial real estate in 2025. Private funds raised $86 billion for North American CRE by August and yearly projections hit $129 billion—a 38% jump from 2024.
REITs secured $48 billion through unsecured debt offerings. This move spurred additional deal-making and active loan origination.
Thirteen of the twenty largest non-secondary equity funds targeted multifamily and industrial asset classes in 2025. These trends prepare the market for shifting demand and supply balances.
Public real estate markets also reopened further. Cushman & Wakefield estimates trailing 12-month unsecured secondary debt offerings for publicly traded U.S. REITs at roughly $48 billion as of Q2 2025, signaling that REITs were again willing, and able, to fund activity through the bond market. Nareit’s tracking shows REIT secondary debt issuance totaling $39.2 billion year to date through Q3 2025.
Where that money wanted to go was not subtle. Among the 20 largest non-secondary real estate equity funds closed year to date in 2025, 13 listed multifamily and or industrial as target sectors, with much of the remainder oriented toward data centers. Industrial demand, in particular, continued to be reinforced by logistics operators: CBRE reported that 3PLs signed 38 of the 100 largest U.S. industrial leases in H1 2025, totaling 28.9 million square feet.
Industrial Sector Highlights
The industrial sector outperformed other commercial properties. Strong transaction activity and steady rent growth, spurred by third-party logistics providers, helped the market reestablish after pandemic highs. Vacancy rates now show a gradual balancing act.
What is the current balance of market demand and supply in industrial real estate?
Industrial real estate in 2025 looked less like a boom and more like a reset in pacing. After several years of rapid building, new supply continued to arrive faster than many markets could absorb it. By Q3, national vacancy had climbed to 7.5%, its highest level in more than a decade, with roughly 310 million square feet still under construction in major development hubs like Dallas-Fort Worth, Houston, and Phoenix.
That headline vacancy rate, though, obscures a growing divide. Smaller spaces under 100,000 square feet remained scarce, with vacancy holding near 5% because the pipeline has skewed toward larger-format product. Big-box logistics buildings absorbed the brunt of the new deliveries, with vacancy pushing above 10% after inventory expanded materially over the past four years. In practice, the market is not uniformly soft. It is softest where construction has been most aggressive and where space is most standardized.
Demand, meanwhile, stayed strong enough to keep rents moving, if more slowly. National asking rents reached $10.10 per square foot in Q3, up 1.7% year over year, and a majority of markets still posted positive rent growth. A handful of metros continued to outperform on pricing, including Miami, where asking rents and growth remained elevated even as vacancy rose, underscoring a central theme of 2025: supply is easing conditions, but it has not erased pricing power in markets with durable tenant demand.

Third-party logistics providers accounted for nearly 20% of U.S. industrial leasing in 2024, a trend driven by cross-border e-commerce platforms like Shein and Temu expanding stateside operations.
Retail Sector Dynamics Explained
The retail sector tightened as consumer spending shifted. Quick-service restaurants and value-driven tenants fueled steady demand. Supply constraints created opportunities in prime locations.
How are retail vacancy rates and expansions trending?
U.S. retail vacancy edged from 4.0% to 4.3% in 2025. Demolition of outdated properties helped keep larger increases in check as older spaces exited the market.
Strip center vacancies dropped sharply. They now stand at 5%, compared to 8.1% ten years ago. Expanding retailers struggled to find quality space amid a tight supply.
Quick-service restaurants led market expansion. The top 50 QSR brands opened 2,722 net new locations in 2024, a nearly 20% rise from 2022-2023 levels, according to Colliers data.

Americans spent over $100 billion at restaurants and coffee shops in July 2025. This spending increased by 5.6% year-over-year and was nearly 50% higher than pre-pandemic levels. The QSR industry is on track for $532 billion in revenue in 2025 as consumer demand stays strong.
Lease-up times averaged 7.3 months, and positive net absorption reached 4.7 million square feet in Q3 after earlier slowdowns in transaction activity and completions.
What consumer demand patterns are affecting retail rents?
High-income shoppers seek value in prime retail locations. Fitness centers, value dining, and entertainment venues saw rising foot traffic as families cut back on costly items.
Quick-service restaurants sent a clear signal. About 37% of adults ate fast food daily, and 71% of QSR operators reported that loyalty programs boosted traffic in 2024. This pushed retail landlords to favor tenants in restaurants, bars, and coffee shops, which comprised around 20% of retail leasing over the past year.
Leasing activity grew in lifestyle centers and mixed-use developments. Asking rents projected a modest 2% gain, while top-tier shopping centers maintained strength.
Multifamily Market Trends
Multifamily investment performed well in key metros during 2025. Absorption rates stayed above historical averages, and rent growth picked up in gateway cities even as new supply pressures emerged.
How is rent growth progressing in the multifamily sector?
Chicago led the nation with 8.1% effective rent growth year-over-year as of Q2 2025, reaching $2,187 per month, according to Berkadia. Lexington, Omaha, and Cincinnati also posted gains above 6%, showing strong momentum in the Midwest.
Nationwide, effective rent growth reached 1.1% over the past year, with rents standing over 20% above 2019 levels.
Class A apartments advanced faster. Higher mortgage rates and rising home prices boosted demand in major urban centers. Gateway metros such as New York, Chicago, and San Francisco posted growth of 4.7%, 3.9%, and 3.4% respectively.
Lower-tier apartments saw reduced occupancy due to affordability pressures. The overall vacancy rate held at 6.5% for nearly a year, signaling steady absorption despite shifts driven by interest rates.
Sun Belt and Western metros lagged. Austin dropped 4.8%, Denver fell 4.1%, Phoenix declined 3.3%, and Las Vegas slipped by 1.7%. Multifamily property prices increased by 1.20% year-over-year, giving clear signals for capital formation.
What are the absorption rates in the multifamily market?
Leasing remained stable in 2025. Net absorption was expected to reach 300,000 units—a drop from 480,000 units in 2024 but still above the historical average of 200,000 units for the third consecutive year.
More than 102,000 units were absorbed in Q3 2025, marking the third straight quarter with net move-ins exceeding 100,000 units.
Occupancy climbed in select markets. Northern New Jersey, New York, and West Michigan reported rates above 97%, and national occupancy hit 95.7% in mid-2025, a three-year high.
High supply areas showed resilience. Year-to-date absorption neared 379,000 units nationally, outpacing new deliveries of roughly 225,000 units. Key metros such as Dallas-Fort Worth, Austin, and South Florida continued to see strong demand.
Even with higher mortgage rates and rising home prices, leasing in multifamily kept steady.
Challenges Facing the Office Sector
The office sector struggled in 2025. Vacancy remained high due to persistent hybrid work models, and sublease inventory grew. These factors complicated real estate valuation and future investment decisions.
What issues are affecting office space availability?
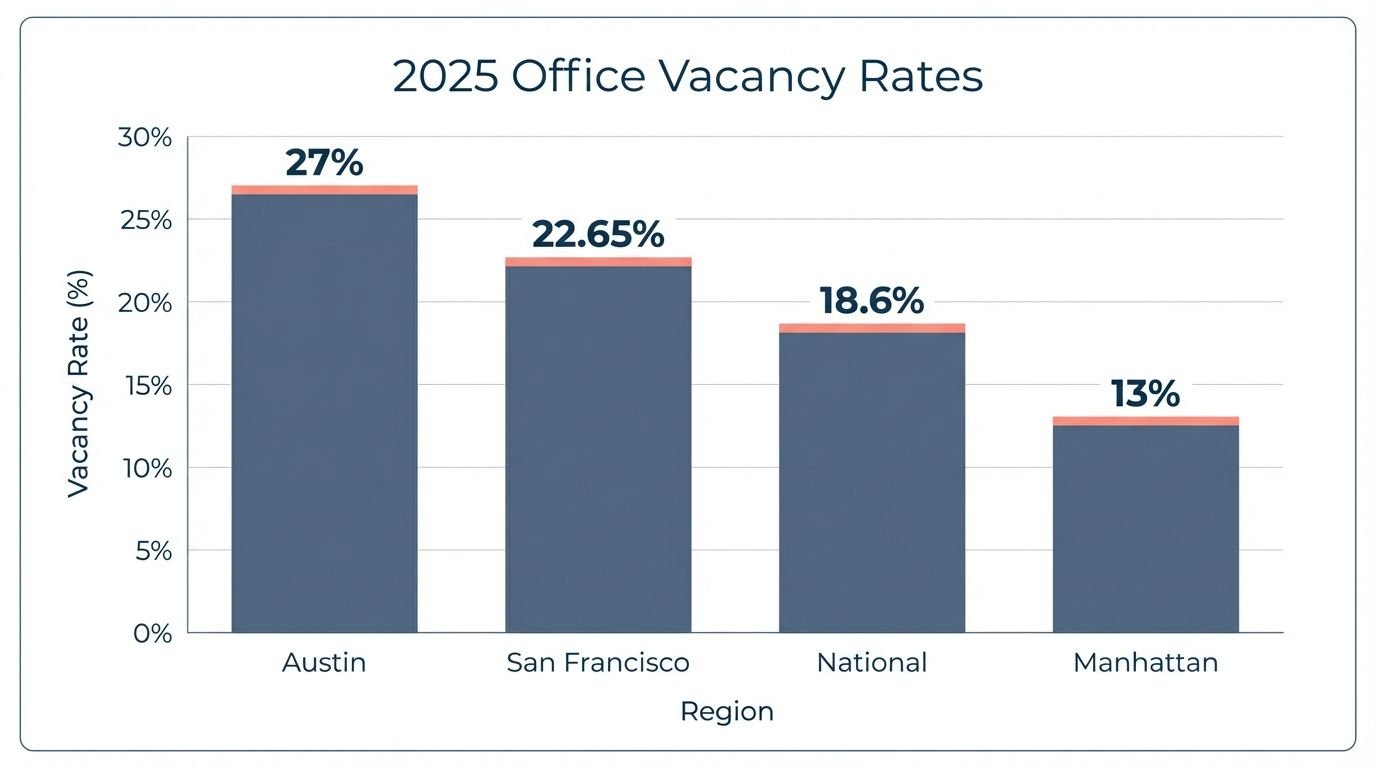
National office vacancy stood at 18.6% in October 2025. This figure is 80 basis points lower than the previous year but remains well above pre-pandemic norms. It reflects significant changes in workplace practices.
Hybrid work models compressed rental prices. About 26% of full-time employees worked in hybrid settings in early 2025, while 13% stayed fully remote. Office utilization rebounded to 70% of pre-pandemic levels by October, though companies now require less space per employee.
Regional differences emerged. Austin and Seattle hit 27% vacancy, San Francisco averaged 22.65%, and Manhattan maintained roughly 13%. Many older office buildings lacked modern amenities, forcing landlords to upgrade if they wanted to attract tenants.
Sublease inventory grew as new office construction fell. Only 33.4 million square feet of office space was under construction nationwide. High construction costs and uncertain economic growth led to a marked slowdown. Class A trophy buildings in prime cities reported vacancies 500 basis points below market average.
How quickly is the office market recovering?
Office leasing volume reached 115 million square feet in Q1 2025—the highest quarterly figure since 2019. Manhattan led with 3.63 million square feet leased in January 2025, 36% above its ten-year monthly average.
San Francisco also showed signs of recovery. Vacancy declined in Q4 2024 after 8.1 million square feet of leases were signed during the year.
The sector recorded its first positive net absorption since Q3 2022 in Q4 2024, reaching 10.3 million square feet. This marks a turnaround after years of decline, though the pace remains moderate.
New office construction dropped to 3.5 million square feet in Q1 2025—the lowest in over a decade. Rising costs and uncertain economic growth played key roles, and office-to-residential conversions picked up as outdated spaces found new uses.
Economic Factors Affecting CRE
Federal Reserve policy began reshaping real estate valuation and building activity in late 2025. Shifts in interest rates have made a clear mark on commercial properties, prompting investors to watch market trends closely as conditions reset for 2026.
How are interest rate reductions influencing commercial real estate?
The Federal Reserve cut rates by 25 basis points in October 2025, setting the federal funds rate at 3.75%-4%. Chair Powell mentioned differences among federal open market committee members regarding any further cuts.
High borrowing costs continued to pressure the market. The 10-year Treasury yield climbed to about 4.47%, which squeezed real estate valuation and complicated refinancing for many investors.
Well-funded buyers exploited these conditions. Asset repricing occurred, especially in the industrial sector, and yield-to-debt spreads are expected to widen into 2026, boosting transaction activity.
Investors sensed a shift as economic growth signs became clearer. Many experts see these rate cuts as a precursor to renewed investment in commercial properties.
What are the current building activity trends across CRE sectors?
New construction slowed sharply in 2025. Developers practiced caution amid higher financing costs across the board. This slowdown was evident in the industrial, retail, and office sectors.
The industrial sector led with about 310 million square feet under construction in key markets like Dallas-Fort Worth, Houston, and Phoenix. Quarterly deliveries fell to 63.6 million square feet, an eight-year low.
Retail and office projects lagged far behind. Office construction dropped to 54.7 million square feet at year-end—just 0.8% of the current stock, a 43.6% year-over-year decline and the lowest since 2013.
Tight lending and shifting demand prompted the slowdown. Senior housing developments saw a surge, supported by a $2.5 billion fund, and self-storage sales reached $1.6 billion in Q3 2025, up 62% year-over-year—even as overall construction levels remained low.
Multifamily completions fell short of absorption. The market projected 485,000 new units in 2025—30% fewer than in 2024. Analysts expect this gap to persist, tightening the supply of affordable housing.
Key Investment Strategies
Investment capital shifted into the industrial and retail sectors in 2025. This move reflected clear market fundamentals and operational strengths in these asset classes.
Why are industrial and retail considered preferred asset classes?
Institutional investors gravitated toward industrial and retail properties in 2025 for one central reason: both asset classes offered reliable fundamentals and clearer visibility in an uncertain capital environment. Industrial demand continues to benefit from the structural tailwinds of e-commerce, logistics expansion, and supply chain reconfiguration, while retail has regained strength through experiential spending and the performance of essential, service-oriented tenants.
Prologis remains a bellwether for industrial performance. After its $23 billion acquisition of Duke Realty in 2022, the company controls roughly 1.3 billion square feet across 20 countries and serves major tenants such as Amazon, FedEx, and DHL. Its scale underscores the market’s sustained preference for logistics infrastructure. Smaller players like EastGroup Properties have leaned into the segment that is proving most durable: 20,000- to 100,000-square-foot facilities near major transport corridors in high-growth Sun Belt markets. That small-bay niche has remained tight, with vacancy near 5%, even as larger logistics buildings have contended with higher vacancy.
Retail’s recovery has been quieter, but it has been measurable. Prime retail space has reached decade-high occupancy in many markets, and investor activity has followed as consumer spending at restaurants and coffee shops has remained above $100 billion per month. Quick-service restaurants have expanded in response, adding 2,722 net new locations in 2024.
For investors, the appeal of both sectors comes down to resilience and adaptability. Industrial landlords can reprice rents as supply and demand rebalance, while retail owners can protect performance by evolving tenant mix to match changing consumer routines.
What other opportunities exist in commercial real estate?
Beyond the core property types, 2025 has highlighted a set of narrower opportunities where capital can still find growth and insulation from broader market swings. Family offices, in particular, have been allocating more to life sciences real estate and self-storage, niches where demand can be driven by structural forces rather than the leasing cycles that shape office and discretionary retail. For investors seeking diversification, both sectors offer clearer usage demand and, in many markets, less direct exposure to rate-sensitive refinancing pressure.
Mixed-use development has also gained momentum as developers and municipalities respond to how people actually live and move through cities and suburbs. Projects that blend residential units with office and retail space are positioned to capture the live-work-play pattern, especially in areas where zoning and transit access support density. At the same time, the office opportunity set has shifted away from traditional leasing and toward reinvention. Coworking, flexible workspace, and adaptive reuse have opened investment channels as tenant demand continues to favor shorter commitments and amenity-rich environments, supported by the persistence of hybrid work.
Technology is increasingly shaping returns through operational efficiency. Investors and operators are backing logistics and building technology that applies predictive analytics and machine learning to cut costs, improve utilization, and strengthen tenant service levels. Suburban retail also presents a differentiated opportunity in select markets, driven by convenience-led shopping behavior and constrained vacancy. Affordable housing remains another durable lane for capital seeking stability, supported by long-term undersupply and steady needs-based demand.
Future Outlook for Commercial Real Estate
Market growth may surge as demographic changes occur. Generational shifts and large-scale wealth transfers will reshape demand across sectors.
What is the expected growth trajectory across CRE sectors?
The industrial and multifamily sectors lead as we move into 2026. E-commerce growth and supply chain pressures continue to drive demand for industrial properties. Experts from CBRE expect third-party logistics providers to keep leasing volumes high.
Data centers grew by 8.9% in 2025 as businesses upgraded digital infrastructure. Multifamily investment remains appealing, with absorption rates rising above completions and Class A rents on the rise. National occupancy reached 95.7% in mid-2025, its highest in three years.
Retail maintained decade-high occupancy despite a lull in new construction. The office sector, however, continues to wrestle with high vacancies, with rates of 18.6% recorded in October 2025. Analysts expect office construction to hit a 25-year low in 2026, which may tighten supply and foster gradual recovery.
How will wealth transfers influence future market activity?
The industrial and multifamily sectors are entering 2026 with the clearest momentum. Demand for industrial space continues to be supported by e-commerce and the operational pressure companies feel to keep inventory closer to customers. Leasing has remained active, and industry observers expect third-party logistics providers to continue accounting for a meaningful share of absorption.
Digital infrastructure has been another bright spot. Data center growth accelerated in 2025 as companies expanded cloud capacity and upgraded systems to support heavier data loads. Multifamily, meanwhile, has retained its appeal because the supply and demand equation has improved. Absorption has outpaced completions in many markets, Class A rents have continued to firm, and national occupancy rose to 95.7% by mid-2025, its highest level in three years.
Retail has been steadier than many predicted. With limited new construction, occupancy has held near decade highs, keeping well-located centers in favor with investors focused on durable cash flow. Office remains the outlier. Vacancy reached 18.6% in October 2025, and the market is still working through weak demand and hesitant lending. The one emerging source of optimism is the pipeline itself. With office construction expected to fall to a 25-year low in 2026, new supply may finally slow enough to support a gradual recovery, especially in markets where higher-quality space remains scarce.
Conclusion
In 2025, industrial real estate set the pace for commercial property markets. Demand held steady even as vacancy rose from the unusually tight conditions of the pandemic era, and large, well-capitalized owners used their balance sheets to keep portfolios competitive. Multifamily also regained traction, supported by improving occupancy and firmer rent growth in markets where new supply began to moderate.
Investor preferences followed the fundamentals. Capital continued to favor industrial for its durability and visibility of cash flow, while retail proved more resilient than expected, buoyed by continued consumer spending and expansion among quick-service and service-oriented tenants. Office remained the laggard, weighed down by elevated vacancies and tighter credit, though a sharp slowdown in new construction could gradually improve the supply side over time.
Looking ahead, strategy will be shaped less by momentum and more by conditions: the path of Federal Reserve policy, the cost and availability of debt, and how quickly refinancing pressure works through the system. A separate catalyst is demographic, as wealth transfers alter the pool of active buyers and the timing of dispositions.
This report is informational and based on a review of market data and industry research, including major bank and brokerage reports and Federal Reserve communications. No sponsorships or paid partnerships influenced the analysis.
FAQs
1. How did the industrial sector perform in the 2025 commercial real estate market?
The industrial sector shifted from rapid growth to stability. Valuations held steady as new construction fell dramatically to match demand. Vacancy rates stayed near 7%, supporting sustainable long-term market health.
2. What challenges did the office sector face in 2025?
The office sector struggled with high vacancy and growing sublease inventory. Signs of recovery appeared as leasing volumes improved in key prime areas.
3. Which sectors showed the most promise for multifamily investment in 2025?
Amid financing constraints, the multifamily sector zeroed in on affordable housing and workforce assets. Middle-income properties in the Sun Belt attracted smart investment, reflecting expectations of a future supply shortage.
4. How did the retail sector adapt to changing market conditions?
Retail properties tested their resilience. Grocery-anchored centers outperformed assets vulnerable to e-commerce by keeping vacancy rates low. Experiential centers have replaced traditional enclosed malls.
5. What key investment takeaways should CRE investors remember from 2025?
Interest rate cuts unlocked new capital, yet digital security remains crucial. The sector must ensure property assets are shielded from cyber threats while relying on secure first-party tenant data to drive value.
References
https://www.credaily.com/briefs/cre-market-update-august-2025-trends-and-insights/
https://northeastpcg.com/the-impact-of-rising-interest-rates-on-real-estate-in-2025/
https://www.cushmanwakefield.com/en/insights/a-new-wave-of-capital-formation-in-us-cre
https://www.credaily.com/briefs/industrial-real-estate-resilience-drives-steady-growth-in-2025/
https://creinsightjournal.com/the-state-of-industrial-real-estate/
https://www.credaily.com/briefs/industrial-rents-slide-in-2025-amid-tariffs-and-lease-pressure/
https://www.credaily.com/briefs/industrial-vacancy-trends-driving-us-warehouse-market-shift/
https://www.jll.com/en-us/insights/market-dynamics/us-retail
https://www.credaily.com/briefs/retail-resilience-shapes-2025-consumer-trends/
https://www.credaily.com/briefs/consumer-spending-trends-impact-retail-and-industrial-sectors/
https://arbor.com/blog/u-s-multifamily-market-snapshot-november-2025/
https://www.credaily.com/briefs/moodys-office-market-challenges-to-deepen-2025/
https://www.credaily.com/briefs/office-recovery-drives-investor-confidence-amid-cre-slowdown/
https://www.bradford.com/how-interest-rates-are-impacting-commercial-real-estate-in-2025/
https://www.credaily.com/briefs/key-trends-shaping-commercial-real-estate-in-2025/
https://www.questorg.com/top-commercial-real-estate-opportunities-for-2025/

Matthew Antonis
Matthew Antonis is a leading figure in the DMV market, recognized for his specialized expertise in Industrial Property and unwavering dedication to client success. His career is defined by high-impact transactions and a data-driven approach that consistently sets new benchmarks in the region.
Matthew made his mark immediately with a monumental debut transaction: securing 161,792 square feet across 11.73 acres, encompassing 14 buildings for $15.2 million. This early success set the tone for a career characterized by lucrative deals and repeat clientele who trust his deep knowledge of the industrial sector.